03 / INTEGRATE

seeing the brain,

Instead of guessing

Symptoms tell part of the story. Brain imaging adds a picture of how your brain is actually working, which is why it anchors the Integrate phase of our method.

TWO WAYS TO LOOK AT THE BRAIN

different tools,

Brain imaging explained: qEEG, ERP and SPECT: Different questions

WHAT WE USE

QEEG BRAIN MAPPING

Sensors on the scalp record the brain's electrical activity at rest, with eyes open and eyes closed, and during a short attention task. Your recording is compared with a database of people your age, so we can see which patterns sit near average and which run high or low. It is non-invasive, uses no radiation, and it is the map our neurofeedback is built from.
Explore the EEG Info research library

COORDINATED WHEN INDICATED

BRAIN SPECT

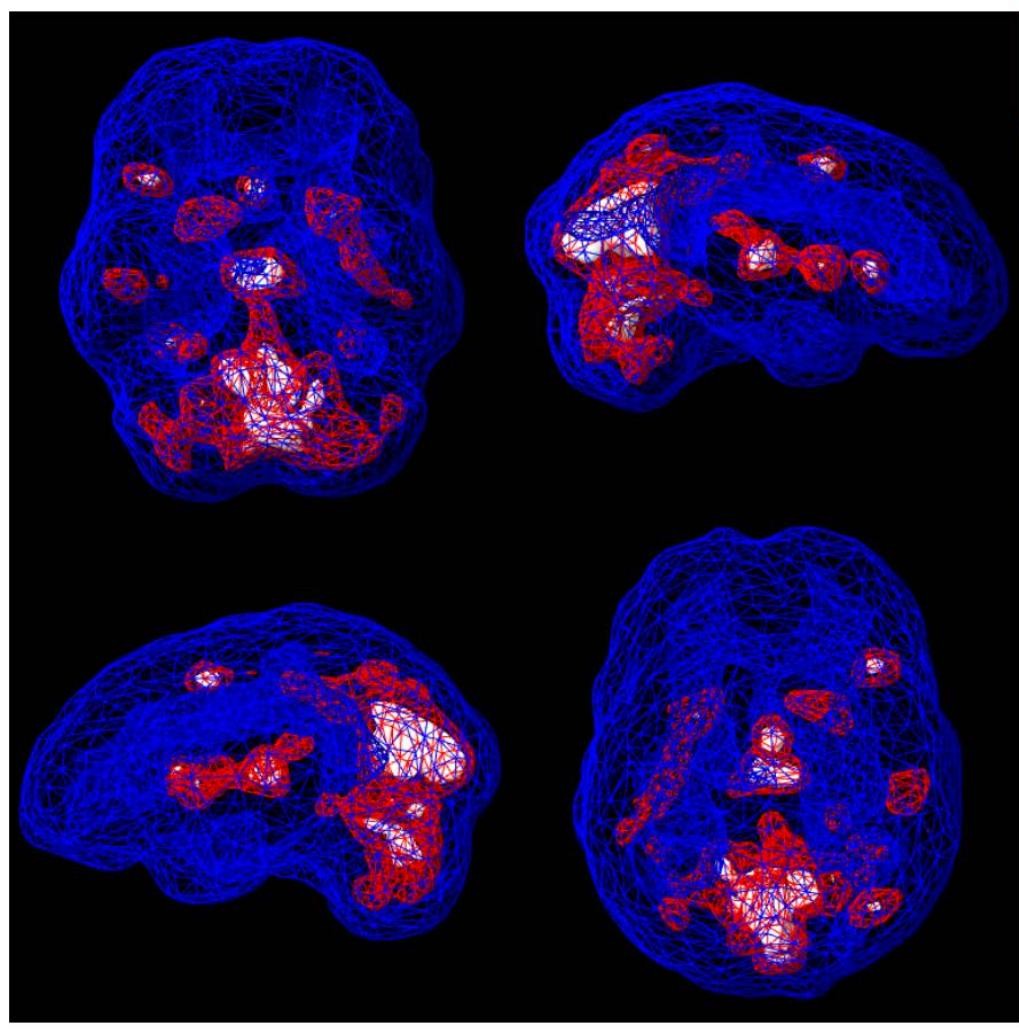
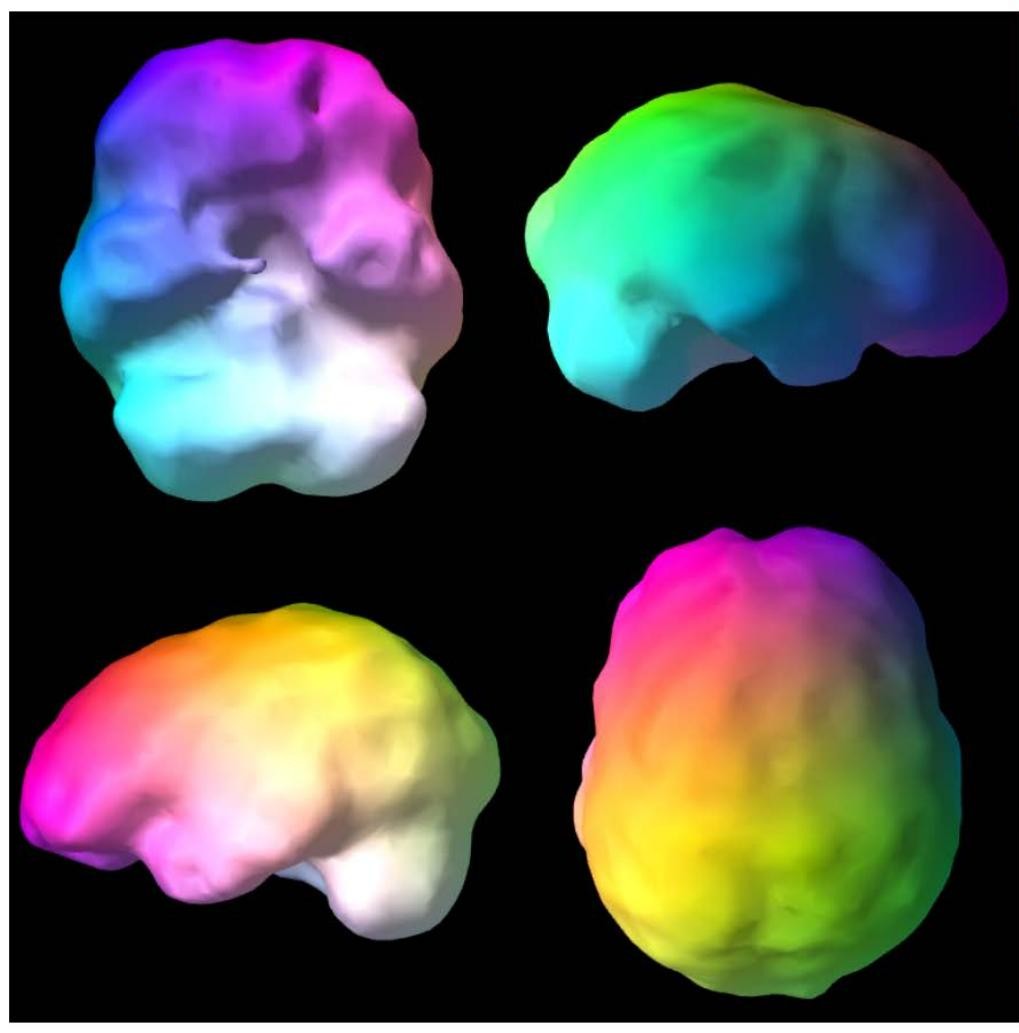
A nuclear medicine scan that shows blood flow and activity patterns across the brain. According to Amen Clinics, brain SPECT has more than 14,000 citations in PubMed, and Amen Clinics has published around 90 peer-reviewed studies across more than 35 years of clinical use. Lili trained through Amen Clinics. SPECT is coordinated with a partner clinic when indicated.

Explore the Amen Clinics SPECT research
Read the peer-reviewed studies

De-identified SPECT scan showing active three-dimensional brain patterns
De-identified SPECT activity visualization.
De-identified SPECT scan showing three-dimensional brain surface patterns
De-identified SPECT surface visualization.

THE PEER-REVIEWED RECORD

read it at the source,

The studies behind spect

Brain SPECT is documented in the peer-reviewed literature, and Amen Clinics publishes its research directly. Rather than summarizing it here, we point you to the studies themselves.

THE PEER-REVIEWED RECORD

read it at the source,

The studies behind neurofeedback

Neurofeedback and EEG research is documented across a large peer-reviewed literature, and EEG Info curates that collection in one place. Rather than summarizing it here, we point you to the studies themselves.

HOW TO READ A BRAIN MAP

an example,

Reading the map

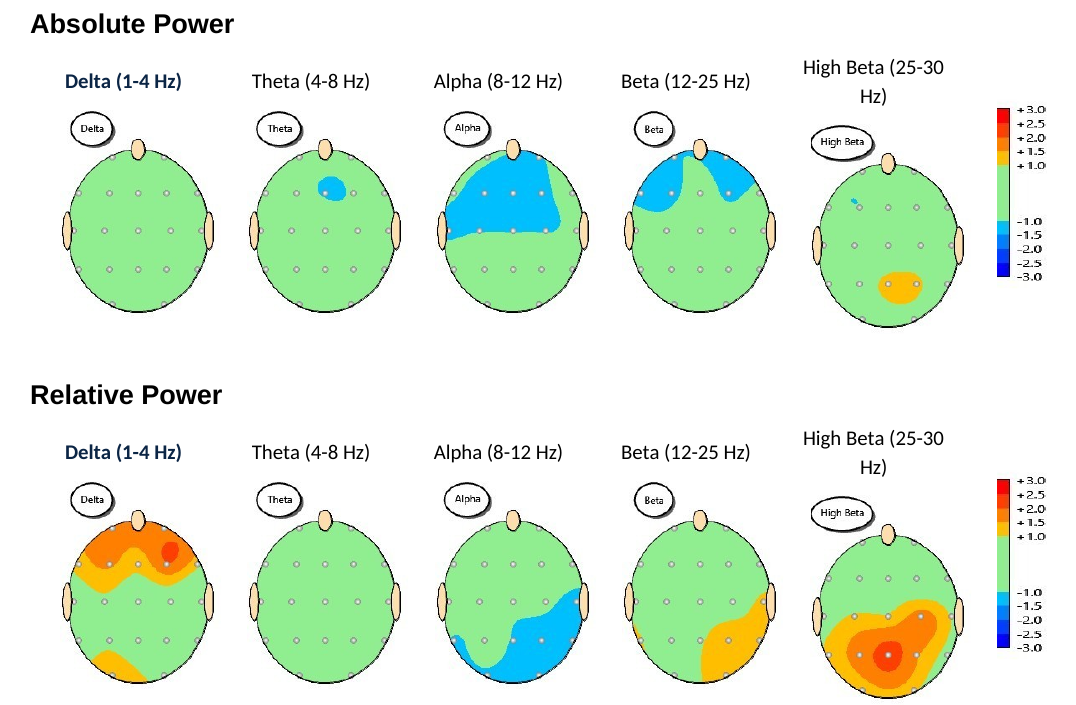
Example qEEG brain maps showing absolute and relative power across five frequency bands
Example from a de-identified qEEG report, shared for education.
  • Each head is seen from above, with the nose at the top. Each dot is a sensor.
  • Each column is a frequency band, from slow waves on the left to fast waves on the right.
  • Green means close to the average for someone the same age. Warm colors run above that average; cool colors run below it.
  • The top row shows absolute power. The bottom row shows relative power.

DELTA

1 to 4 Hz

the slowest waves, most associated with deep sleep.

THETA

4 to 8 Hz

drowsy, inward, dreamlike states.

ALPHA

8 to 12 Hz

calm, relaxed alertness, strongest with eyes closed.

BETA

12 to 25 Hz

active thinking, focus and problem solving.

HIGH BETA

25 to 30 Hz

effort and vigilance, which can run high when the system is overactivated.

THE ATTENTION TASK

GO / NO-GO RESPONSE

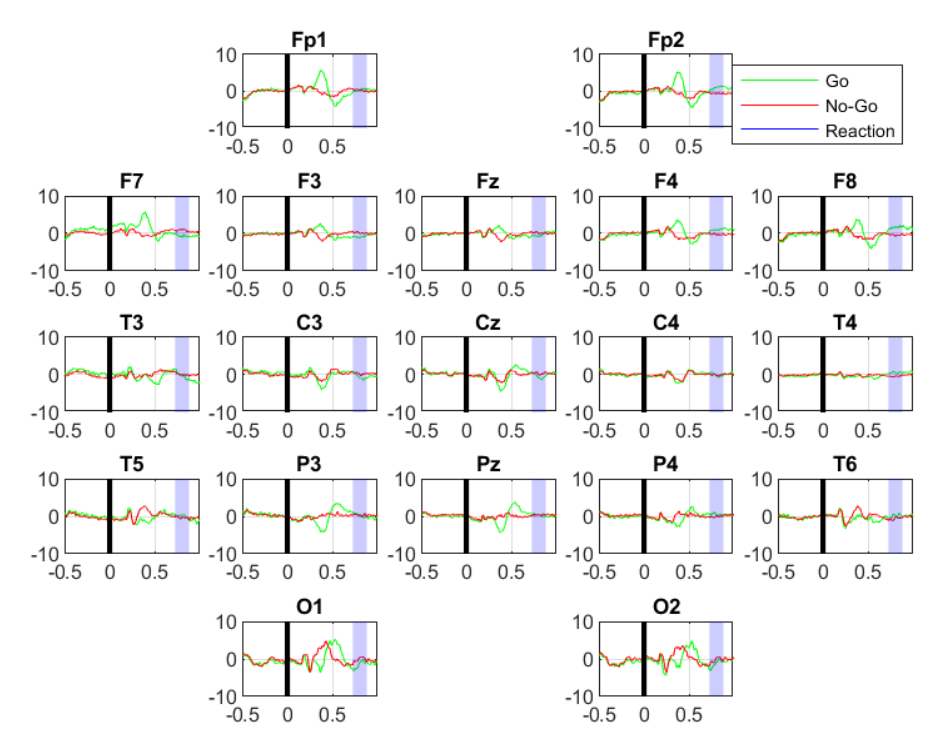
During a short attention task, the brain's response to each prompt is recorded at every sensor. The lines compare the response when you are asked to act with the response when you are asked to hold back. Together they show how the brain handles attention and impulse control, not just how it idles.

Example ERP attention-task chart comparing Go and No-Go brain responses at each sensor
De-identified ERP attention-task example.

WHAT A MAP IS, AND ISN'T

one part,

Of the whole picture

A brain map is a picture of patterns, read alongside your history, your labs and your life. It is not a diagnosis on its own, and it is always interpreted by a clinician.

from map,

To practice

Your map guides neurofeedback and photobiomodulation with our neurofeedback team, Pete Beaman, RN, and Ryan Dekoning, B.S. Neuroscience. Neurofeedback gives the brain real-time feedback on its own activity so it can practice steadier patterns.